Cachar · Karimganj · Hailakandi · Dima Hasao
Which roads still work tomorrow.
Existing systems report that a flood is happening. SetuNER estimates which roads will still carry a truck tomorrow, and what can reach the people who need supplying — from daily government reports, satellite rainfall, terrain and reports from the ground.
The Barak Valley · MODIS Terra · 10 Feb 2026 · NASA Worldview
What the water does
The same valley, eight months apart.
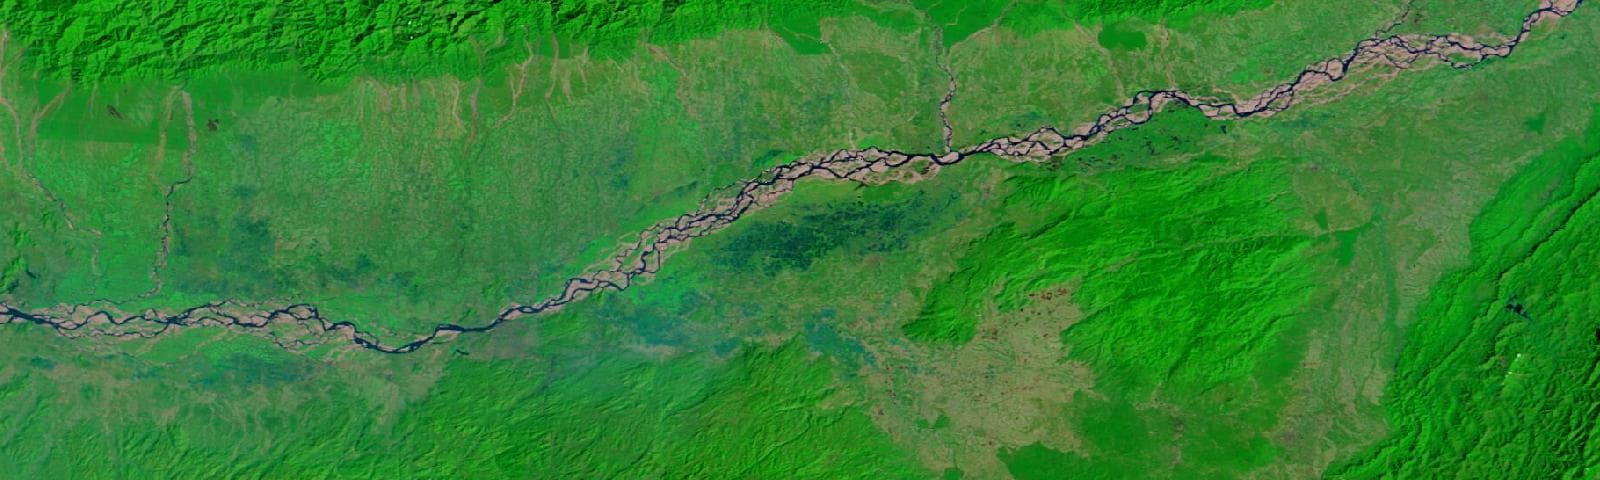
10 February 2026
Dry season. The Brahmaputra is a thread inside its own bed.
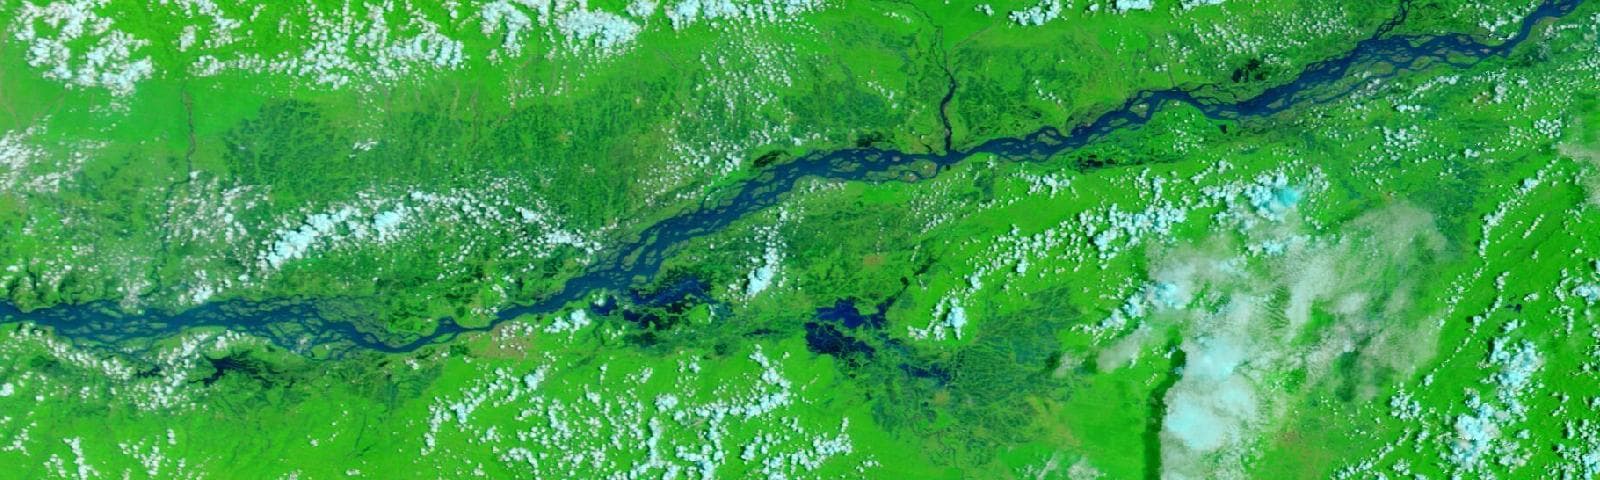
8 June 2025
The week 22 districts were listed as flood-affected in this project record.
False colour: water reads as deep blue, vegetation as green, cloud as white. MODIS Terra bands 7-2-1, NASA Worldview.
The 2025 flood, as it happened
The rain arrives days before the report does.
Cachar · 24 May – 18 June 2025
Rainfall, and the days the district was listed as flood-affected.
What the chart shows
Each bar is a day of rainfall over Cachar, measured by satellite. The red band underneath marks the days the government report listed the district as flood-affected, and the dashed line is the first of them.
Why it matters
Rain builds from 25 May, five days before the district appears in any report. The heaviest day of all — 90 mm on 31 May — lands after the flood is already declared. A system that waits for the report is always reading the past; the rainfall was there to be read the whole time.
What is not claimed
This is one district in one season, shown to explain the idea. Whether rainfall actually improves the forecast is a separate question, tested properly and answered honestly on the forecast page: it won on the held-out season, lost on validation, and is now on trial rather than in service.
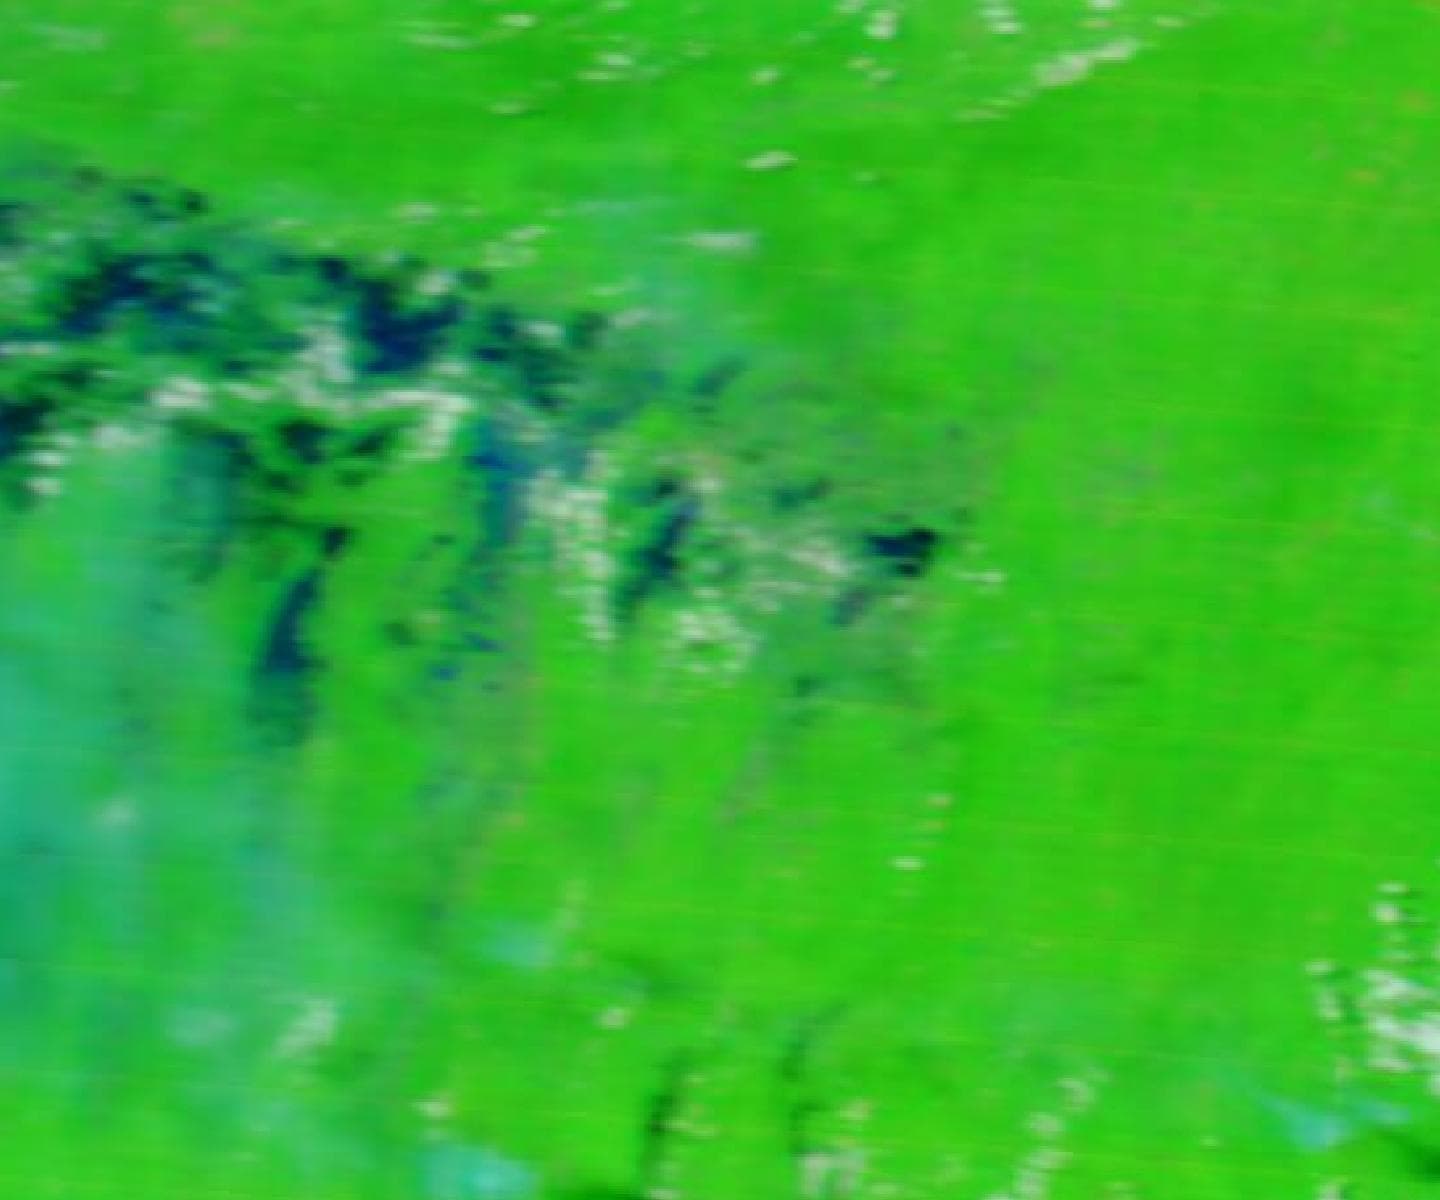
12 June 2025 · the corridor, finally visible
Dark navy is water standing on the valley floor. MODIS Terra bands 7-2-1.
And this is the picture
It is a clear view of the flooded corridor — and it is dated 12 June, thirteen days after the district was first listed and long after the trucks needed routing.
On 1 June, the day it flooded, the same satellite returned solid cloud. That is the ordinary case during a monsoon, not bad luck: the weather that causes the flood is the weather that hides it. Radar can see through cloud, which is why Sentinel-1 flood extent is on the roadmap and honestly marked as not built.
Screens
Accessibility model →
Next-day flood forecasts for every Assam district, turned into per-road accessibility for the corridor — each one explained, and judged against a persistence baseline.
Supply planning →
Plan water and food runs to relief camps from real demand, on routes that weigh time against exposure to at-risk roads, with the binding constraints spelled out.
Scenarios →
Close or flood roads and bridges and see what it does to a route across the Barak Valley — the corridor's single points of failure made visible.
Field reports →
Report a road as clear, slow or blocked. Reports are weighted by reporter trust and checked against official damage data.
Saved plans →
An audit trail: plans frozen with their inputs, explanation and model versions, and the overrides operators recorded against them.
Baseline map →
The 2025 historical accessibility baseline every forecast is compared against.
Built on
- 110,266 road segments from OpenStreetMap, with terrain from the Copernicus DEM
- ASDMA DRIMS daily flood reports since May 2025, ingested every morning
- NASA GPM IMERG satellite rainfall, one file per day
- Relief-camp populations per revenue circle, from the same reports
What it does not claim
- Rainfall is collected but not yet served — a model using it has to beat the current one on days neither has seen first.
- Per-road risk uses a stated terrain assumption, not a fitted model.
- Depot stock and fleet are operator inputs; the defaults are examples.
- Not an official advisory service. It is an engineering project built on public data.